- Latest News
- Ferrexpo decreased iron ore pellets production in January
- Ferrexpo is not to issue Eurobonds in coming months
- S&P upgrades credit rating of Ferrexpo to B-
- BlackRock increases share in Ferrexpo up to more than 5%
- Wigmore Street Investments fully sold its stake in Ferrexpo
- Ferrexpo aims to refinance its debt
- Ferrexpo shareholder sells portion of its stocks
- S&P affirms Ferrexpo rating at CCC, outlook ‘negative’
- Latest Reports
- Ferrexpo reports financials for Y2016
- Ferrexpo reports its production for Q4 2016
- Ferrexpo reports its production for Q3 2016
- Ferrexpo reports financials for 1H2016
- Upcoming
- 6 April 2017 - Q1 2017 production report
Business description
Ferrexpo is one of the largest world supplier of pellets to the global steel industry and the largest exporter of pellets from CIS countries. As a result of sizable investments into operations during last years (USD 2.0bln since Y2007), total pelletising capacity of the company reached 12Mt, and in Y2015 the share of premium 65% iron content pellets in total production volume made 89%. Moreover despite negative market environment (significant decrease of world iron ore prices during last period of time) in Y2015 the group demonstrated record-high level of annual production at 11.662M tons.
As high-quality pellets producer Ferrexpo is in niche segment that represents 250M tons of supply out of total world iron ore market of 2 bln tons of production.
The Group’s mining operation assets are situated in Poltava region (Central Ukraine), 425 km from the conflict zone in the East of Ukraine. Asset base is the largest iron ore deposit in Europe with approximately 20 bln tons of resources.
The ore mined is beneficiated into high grade concentrate, which is then fired into iron ore pellets. Pellets are transported by rail, primarily with Ferrexpo’s own rail cars (more than 2200 railcars in ownership), from the mines to the western border of Ukraine (more than 60% of production is exported to European countries) and to the TIS-Ruda port (for seaborne shipments; Ferrexpo owns 49% stake in TIS-Ruda port terminal, securing its port logistics). 100% of Ferrexpo production is exported.
Traditional markets for pellets produced by Ferrexpo are countries of Central and Eartern Europe, key traditional customers are based in Austria, Czech Republic and Slovakia (region accounted for more than 50% of total realization in Y2015). Also natural markets for the company (from logistics point of view) are Turkey, Germany, Middle East. In addition, being relatively cost competitive, Ferrexpo tries to develop its operations also on Asian markets (share in total realization – more than 30% in Y2015).
Since June’07 Ferrexpo has been listed on LSE under the ticker symbol FXPO. Current free float is – 36%.
Operating Figures
| 2016 | 2015 | 2014 | 2013 | |
|---|---|---|---|---|
| Total pellets production, k tons | 11 200 | 11 661 | 11 021 | 10 800 |
| 65% Fe pellets, k tons | 10 535 | 10 366 | 5 803 | 5 000 |
| Share of 65% Fe pellets, % | 94% | 89% | 53% | 46% |
| Production from own ore, k tons | 11 071 | 11 258 | 11 670 | 10 466 |
Financial information
| USD k | 2016 | 2015 | 2014 | 2013 | 2012 |
|---|---|---|---|---|---|
| Sales | 986 325 | 961 003 | 1 388 385 | 1 581 385 | 1 424 030 |
| Gross Profit | 585 992 | 514 247 | 740 325 | 808 164 | 733 301 |
| EBITDA | 375 000 | 313 000 | 496 298 | 505 896 | 405 000 |
| EBITDA margin, % | 38% | 33% | 36% | 32% | 28% |
| Net Profit | 189 200 | 31 458 | 183 840 | 263 784 | 218 598 |
| 31.12.16 | 31.12.15 | 31.12.14 | 31.12.13 | 31.12.12 | |
| Total Assets | 1 162 977 | 1 225 577 | 2 134 895 | 2 932 369 | 2 758 458 |
| Fixed Assets | 804 013 | 929 258 | 1 203 373 | 2 017 242 | 1 662 550 |
| Current Assets | 358 964 | 296 319 | 931 496 | 915 127 | 1 095 908 |
| Inventory | 78 935 | 96 021 | 124 722 | 180 863 | 134 111 |
| Cash | 144 751 | 44 638 | 626 509 | 390 491 | 596 560 |
| Equity | 324 135 | 243 931 | 717 601 | 1 735 042 | 1 547 398 |
| Debt | 733 902 | 903 650 | 1 304 627 | 1 029 239 | 1 019 985 |
| 2016 | 2015 | 2014 | 2013 | 2012 | |
| Net Operating CF | 332 091 | 127 866 | 288 448 | 232 926 | 118 578 |
| Financing CF | -176 803 | -486 732 | 193 022 | -81 555 | 7 068 |
| Dividends paid | 0 | -77 548 | -76 904 | -77 883 | -38 775 |
| Net Borrowings | -176 803 | -393 876 | 269 926 | -3 672 | 45 843 |
| Investing CF | -43 758 | -19 603 | -224 084 | -357 184 | -419 337 |
Latest financial report of the company
Comments to financials:
- Revenues of the company have been generally in line with our expectations and made USD 986M (by 2.6% higher y-o-y). Total production volume decreased vs. previous year by 4%, as Ferrexpo concentrated on premium 65% Fe pellets output (which grew by 1.6%), while lower grade production much declined. Despite decrease of output and because of rather high inventory stock as of beginning of Y2016, the group increased volume of sales in natural terms by 3.3% up to 11.7M tons.
- Average iron ore price index (for 62% Fe iron ore) for the whole Y2016 has been slightly higher than in previous year (USD 58/t vs. USD 56/t), average pellet premiums (difference between 65% Fe pellets prices and 62% Fe iron ore index) for non-Chinese markets slightly declined vs. Y2015 and made USD 32/t (in Y2016 Ferrexpo sold 65% of production to European markets, so Chinese premiums are not much relevant to its activity). Premiums have been supported during the year because of restricted supply (one of main Ferrexpo competitors – Samarco – is still out of the market) and rather good demand (due to increase of coking coal prices, attractiveness of premium pellets for steel mills grew as well).
- In a view of relatively stable revenues, decreased cost of production was main driver of Ferrexpo EBITDA growth - up to USD 375M in Y2016 vs. USD 313M a year ago. EBITDA margin reached 38% (33% in Y2015). We note that in a view iron ore price dynamics, in H1 2016 performance of the company in terms of profitability (in H1 2016 EBITDA made USD 160M) has been worse than in H2 (USD 215M).
- C1 cash cost of the company decreased from USD 30.6/t in H2 2015 to USD 25.7/t in H1 2016 before growing to almost USD 30/t in H2 2016. On average in Y2016 C1 cash cost made USD 27.7/t (USD 32/t in Y2015). Main factors of decline – UAH devaluation (50% of Ferrexpo costs are linked to UAH), decrease of average oil&gas prices, efficiency savings. In H2 2016 C1 cash cost increase vs. H1 was mainly related to higher ois&gas prices. Historical C1 cash cost dynamics of Ferrexpo is represented on the chart below (source link):
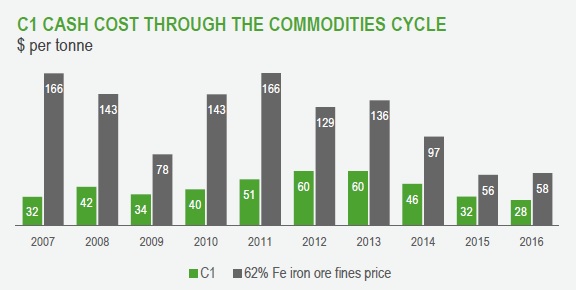
- Main constituents of C1 cash cost for Ferrexpo have been electricity, gas&fuel, materials and personnel.
- On positive side for the company has been the fact that not only EBITDA, but operating cash flow in Y2016 has been quite strong – at USD 332M. It allowed Ferrexpo not only to repay borrowings in total amount of almost USD 200M, but also to increase cash balance from USD 35M as of 31.12.15 up to USD 144M, which provides the company with margin of safety for the future activity.
- According to existing schedules in Y2017 Ferrexpo is to repay about USD 200M of debt principal, in Y2018 – close to USD 320M. In addition the company decided to pay USD 40M as dividends and realize total investments for about USD 100-110M in Y2017.
- Taking into account average iron ore index (62% Fe) in Q1 2017 has been at USD 85/t, pellet premiums – quite strong, we can estimate that EBITDA of the company in Q1 2017 has been not less than USD 150-170M. Even if iron ore prices (as predicted by a lot of industry analysts) will decline till the end of Y2017 to USD 50-55/t, annual EBITDA of Ferrexpo will be close to USD 400M. If we subtract from this amount planned investments (USD 110M), interest expenses (about USD 50M) and dividends (USD 40M), remaining free cash flow will be close to USD 200M, which will be sufficient to repay debt principal without decrease of cash balance. It means that under above assumptions cash balance for Y2017 end will be at about USD 150M (close to the level of 31.12.16). In this case, provided there will be no significant geopolitical problems in Ukraine during Y2017, chances of Ferrexpo to refinance debt maturing in Y2018 will be rather high.
| Current share price, USD | |
| Change, % | |
| Market Capitalization, USD M | |
| Valuation and credit metrics | |
| P/E ratio | |
| MV/BV ratio | |
| EV/EBITDA ratio | |
| Debt/Sales ratio | |
| Net Debt/EBITDA ratio | |
| Debt/Equity ratio |