23 March 2017
Driven by growing iron ore prices and pellets premiums Ferrexpo reported good financial performance results for Y2016. Ukrainian company remains one of the most cost-efficient iron ore pellets producers in the world.
Key financials
USD M
2016
2015
Change, %
Revenues
986
961
3%
EBITDA
375
313
20%
EBITDA margin, %
38%
33%
-
Operating Cash Flow
332
128
260%
Key operating and financial performance figures:
2016
2015
Change, %
Sales volumes, k tons
11 697
11 330
3%
Average 62% Fe iron ore price, USD/t
58.3
55.6
5%
Average pellets premium (non-Chinese markets), USD/t
32
34
-6%
Average C1 cash cost, USD/t
27.7
31.9
-13%
EBITDA, USD M
375
313
20%
Revenues of the company have been generally in line with our expectations and made USD 986M (by 2.6% higher y-o-y). Total production volume decreased vs. previous year by 4%, as Ferrexpo concentrated on premium 65% Fe pellets output (which grew by 1.6%), while lower grade production much declined. Despite decrease of output and because of rather high inventory stock as of beginning of Y2016, the group increased volume of sales in natural terms by 3.3% up to 11.7M tons.
Average iron ore price index (for 62% Fe iron ore) for the whole Y2016 has been slightly higher than in previous year (USD 58/t vs. USD 56/t), average pellet premiums (difference between 65% Fe pellets prices and 62% Fe iron ore index) for non-Chinese markets slightly declined vs. Y2015 and made USD 32/t (in Y2016 Ferrexpo sold 65% of production to European markets, so Chinese premiums are not much relevant to its activity). Premiums have been supported during the year because of restricted supply (one of main Ferrexpo competitors – Samarco – is still out of the market) and rather good demand (due to increase of coking coal prices, attractiveness of premium pellets for steel mills grew as well).
In a view of relatively stable revenues, decreased cost of production was main driver of Ferrexpo EBITDA growth - up to USD 375M in Y2016 vs. USD 313M a year ago. EBITDA margin reached 38% (33% in Y2015). We note that in a view iron ore price dynamics, in H1 2016 performance of the company in terms of profitability (in H1 2016 EBITDA made USD 160M) has been worse than in H2 (USD 215M).
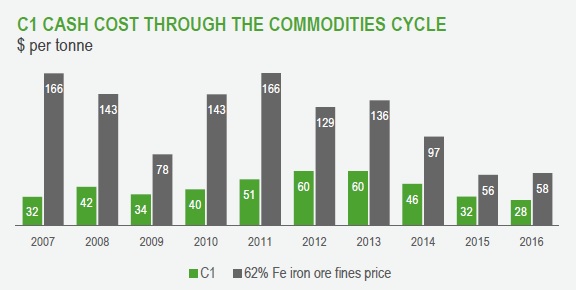
C1 cash cost of the company decreased from USD 30.6/t in H2 2015 to USD 25.7/t in H1 2016 before growing to almost USD 30/t in H2 2016. On average in Y2016 C1 cash cost made USD 27.7/t (USD 32/t in Y2015). Main factors of decline – UAH devaluation (50% of Ferrexpo costs are linked to UAH), decrease of average oil&gas prices, efficiency savings. In H2 2016 C1 cash cost increase vs. H1 was mainly related to higher ois&gas prices. Historical C1 cash cost dynamics of Ferrexpo is represented on the chart below (source link):

On positive side for the company has been the fact that not only EBITDA, but operating cash flow in Y2016 has been quite strong – at USD 332M. It allowed Ferrexpo not only to repay borrowings in total amount of almost USD 200M, but also to increase cash balance from USD 35M as of 31.12.15 up to USD 144M, which provides the company with margin of safety for the future activity.
According to existing schedules in Y2017 Ferrexpo is to repay about USD 200M of debt principal, in Y2018 – close to USD 320M. In addition the company decided to pay USD 40M as dividends and realize total investments for about USD 100-110M in Y2017.
Taking into account average iron ore index (62% Fe) in Q1 2017 has been at USD 85/t, pellet premiums – quite strong, we can estimate that EBITDA of the company in Q1 2017 has been not less than USD 150-170M. Even if iron ore prices (as predicted by a lot of industry analysts) will decline till the end of Y2017 to USD 50-55/t, annual EBITDA of Ferrexpo will be close to USD 400M. If we subtract from this amount planned investments (USD 110M), interest expenses (about USD 50M) and dividends (USD 40M), remaining free cash flow will be close to USD 200M, which will be sufficient to repay debt principal without decrease of cash balance. It means that under above assumptions cash balance for Y2017 end will be at about USD 150M (close to the level of 31.12.16). In this case, provided there will be no significant geopolitical problems in Ukraine during Y2017, chances of Ferrexpo to refinance debt maturing in Y2018 will be rather high.
Popular on site:
Kernel reports financials for Q2 FY2017
MHP reports Y2016 financials
Interpipe reports its main operating results for Y2016