24 October 2016
Financial performance of Kernel Holding in Q4 2016 and financial year as a whole was in compliance with our expectations with decline in sales and EBITDA. In addition the company reported rather weak operating results for its oilseeds crushing segment for Q1 FY2017. On positive side are good new crop prospects and also rather good balance sheet quality of the company.
Key financials
USD k
FY2016
FY2015
Sales
1 988 520
2 329 507
EBITDA
346 400
396 600
EBITDA margin, %
17.4%
17.0%
Net Profit
226 844
95 533
Main business directions performance
USD k
FY2016
FY2015
FY2014
Oilseeds crushing
Sales
1 134
1 214
1 211
EBITDA
128.8
213.1
177.8
EBITDA margin, %
11%
18%
15%
Grains trading
Sales
822
1 053
1 053
EBITDA
46.3
59.4
59.4
EBITDA margin, %
5.6%
5.6%
5.6%
Farming
Sales
358
310
290
EBITDA
146.0
97.9
-44.3
EBITDA margin, %
40.8%
31.5%
-15.3%
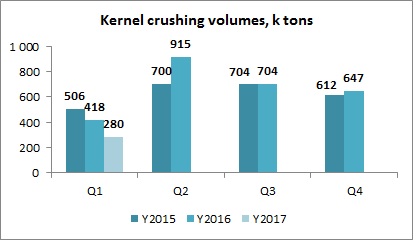
Total revenues in last reporting quarter of financial year 2016 (JulyÆ15-JuneÆ16) made USD 382.3M, by 22% lower than in Q4 FY2015. Decline was mainly related to sales in oilseeds crushing segment (y-o-y decline in natural terms made 26%). As a result total segmentÆs revenues in FY2016 made USD 1 134M vs. USD 1 214M in previous year (decline by 6.6% despite record-high crushing volumes of 2.7M tons reached due to purchase of ex-Kreativ crusher). For Q1 2017 picture is even worse ¢ total crushing volumes decreased by 33% even vs. not the best Q1 FY2016.Quarterly crushing volumes of Kernel during last period of time are represented on the chart below:
We see two main reasons of worse than expected performance during last quarters ¢ competition between crushers and (potentially) activity of some ōgreyö crushers (we can assume it as sunflower oil export dynamics in last marketing year was better vs. official production dynamics).
As we expected before, crushing margin in last financial year significantly declined ¢ to 11% vs. 17% a year ago. Two main factors: 1) positive but not sustainable influence of UAH devaluation on margins in FY2015; 2) higher competition for raw materials in FY2016 (also potentially from ōgreyö market players). In new season, in a view of sunflower seeds arvest increase in Ukraine, supply of raw materials is to be higher, along with it, crushing capacities also increased, so Kernel does not expect margins growth in new season.
Total grains trading volume in Q4 2016 made 0.744M tons, almost by 50% lower than in previous quarter and by 5% lower y-o-y (in addition average segment margin declined to 2.6%). As a result segment revenues declined vs. corresponding period by 15%. In FY2016 total proceeds in grains trading made USD 822M (-22% vs. FY2015, while in natural terms decline made 7%), EBITDA ¢ USD 46M with quite stable margin of 5.6% (we expect it to somewhat decrease in new season). On positive side here is growth in grains trading volumes in Q1 FY2017 (1 182M tons, +27.5% y-o-y).
Results of Terminals&Silo business directions in last year have been quite stable vs. previous year, they represent stable sources of income for the company (EBITDA in FY2016 made USD 61M vs. USD 55M a year ago). On the other side in a view of increasing competition on transshipment market we can forecast some decline in Ukrainian terminals margin in future years (at the moment margins are much higher than in the rest of the world at 60-70%).
The best results in last financial year among Kernel business segments were reported by Farming segment. EBITDA of segment made USD 146M with margin 41%. Here one should note influence of devaluation (like for main part of other Ukrainian farmers, costs of which were incurred under lower USD/UAH rate vs. rate when crops were realized), but even disregarding this influence results have been much better vs. previous years (we estimate ōrealö (w/o influence of devaluation) EBITDA of Kernel Farming direction in last year at 25-30%). Moreover we expected even better picture for FY2017, as factual&projected yields for main crops are quite good:
Season
2016/17
2015/16
2014/15
2013/14
2012/13
2011/12
Corn
8.6 7.3 7.1 5.5 4.6 7.1
Wheat
5.9 5.1 5.4 4.3 3.4 3.7
Sunflower seeds
3.0 2.7 2.5 2.1 1.7 2.1
Soybeans
2.7 1.8 1.8 1.4 1.3 1.9
Balance Sheet structure
30.06.16
30.06.15
Total Assets
1 509 355
1 465 618
Fixed Assets
788 888
807 060
Current Assets
720 467
658 558
Inventory
390 525
302 327
Equity
997 055
890 844
Debt
319 666
462 518
Kernel assets structure as of 30.06.16 has been relatively stable vs. 30.06.15, main changes related to increase of Inventory by USD 85M at account of slightly higher cost per 1 ha in Farming and high sunflower oil stock as of end of period (+USD 65M y-o-y). As for investment program, main investment during last year was made into ex-Kreativ asset (was preliminary booked at preliminary fair value of USD 64.3M, cash already paid for this asset ¢ about USD 50M). Along with it, following recent de-leveraging (please see below) the company is to resume its active investment program ¢ in plans of Kernel are construction of new grains port terminal (to be launched in Y2018, investments tomake about USD 100M) and increase of oilseeds crushing capacities by up to 1.5M tons (current, including tolling, are at 3.5M tons).
NOCF of Kernel in FY2016 made USD 133.7M (USD 404.7M in FY2015), directed to new investment and loans repayment (USD 115M). Financing structure of the company remains quite good. After repayment of approximately 50% of its total debt portfolio in last two financial years (USD 400M in absolute terms), current Debt/Equity ratio of Kernel is close to 0.3x, Equity (USD 997M as of 30.06.16) exceeds Fixed Assets and is main source of assets financing in general, so financial position of the company is clearly good. In addition current adjusted Net Debt/EBITDA ratio Is close to 0.75x.
Popular on site:
Agrogeneration releases its financial report for 1H 2016
MHP releases Q3 2016 operating report
Ovostar - Q3 2016 operating report