27 March 2018
Driven by favorable market situation and general cost efficiency of the company financial performance of Ferrexpo in Y2017 has been good.
Key financials
USD M
Y2017
Y2016
Change, %
Revenues
1 197
986
21%
EBITDA
551
375
47%
EBITDA margin, %
46%
38%
-
Operating Cash Flow
353
332
6%
Key operating and financial performance figures:
Y2017
Y2016
Change, %
Sales volumes, k tons
353
332
6%
Average 62% Fe iron ore price, USD/t
71.3
58.3
22%
Average pellets premium , USD/t
44
31
42%
Average C1 cash cost, USD/t
32.3
28.5
13%
EBITDA, USD M
551
375
47%
Due to one of pellet line refurbishment (four lines in total; one line should be refurbished once in 15-20 years) and general increase in maintenance levels total pellets production of Ferrexpo in Y2017 decreased y-o-y by 7% and made 10.444M tons. Pellets sales volume declined by 11% to 10.467M (difference in production and sales dynamics is explained by high pellets stocks of Ferrexpo in the beginning of Y2016).
Average iron ore price index (62% Fe, CFR China) in Y2017 made $71.3/t vs. $58.3/t a year ago, which became one of the principal factors of Ferrexpo revenues and profitability growth. Iron ore price has been rather volatile throughout Y2017, having reached in the end of the year $78/t (source - BusinessInsider):
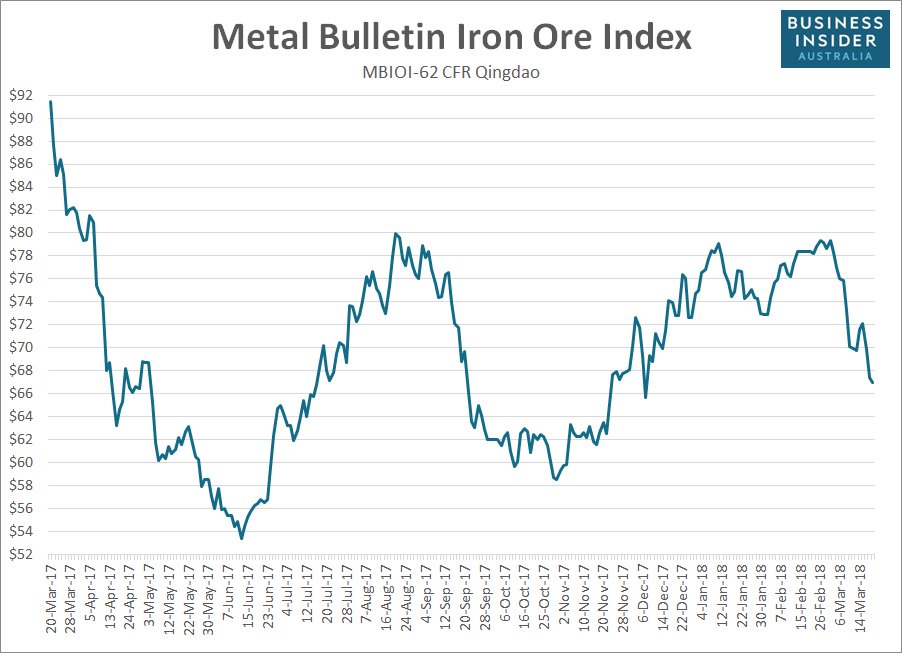
During March 2018 iron ore index significantly declined and its current value is close to $65/t. Along with it probability of its further decline in short-term perspective remains non-minor, taking into account uncertainty related to Chinese steel sector and high iron ore stocks in Chinese ports.
The second principal factor of Ferrexpo financial performance improvement has been growth of Fe 65% iron ore pellets premium. In Y2017 average value of Platts Atlantic pellet premium made about $45/t, which has been the highest value for the last nine years (source – Ferrexpo report):
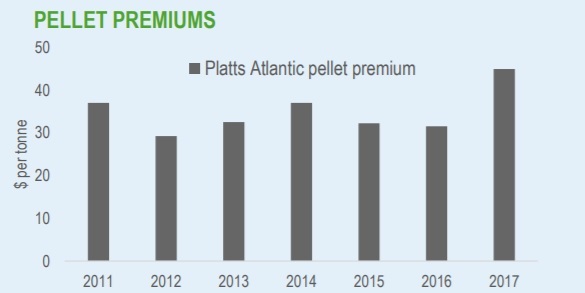
It is expected that in short-term premiums will stay at close to current highs, moreover in the long run, taking into account focus of Chinese authorities on reduction of air pollution by steel mills, we can expect that demand on pellets will still be high (from supply point of view one should not forget that one of the largest iron ore pellets producers – Samarco – is still out of the market and will gradually re-start operations not earlier than in H2 2018).
Certain negative for Ferrexpo factor in Y2017 has been growth of freight rates (mainly as a consequence of oil prices increase), its impact on profitability was estimated by the company at $6/t.
So in Y2017 total revenues of Ferrexpo made $1 197M (+21% y-o-y). Geographical sales distribution looked as follows: Europe – 65% (main off-taker here is Voestalpine), Far East (mainly Japan) – 16%, China and South East Asia – 12%.
As for costs, in Y2017 C1 cash cost of the company made $32/t ($28.5/t a year ago). Dynamics during last years looked as follows:
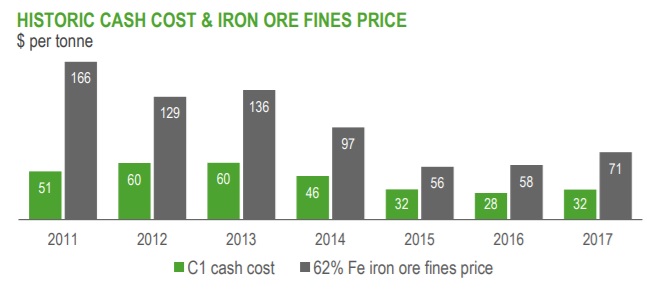
Ferrexpo remains one of the most cost efficient 65% Fe pellets producers in the world. Net cost structure is following: electricity – 28%, gas and fuel – 19%, raw materials – 21%, salaries – 8%. Increase of C1 cash cost has been mainly related to growth of energy sources prices and general inflation in Ukraine.
So, despite certain increase of net cost, due to growth of general iron ore index as well as pellets premiums, Ferrexpo EBITDA increased from $375M in Y2016 up to $551M.
Operating cash flow made $353M (at the level of previous year, difference vs. EBITDA appeared mainly because of working capital increase by $110M (including growth of low grade iron ore stocks by $53M)) and was directed to debt repayments ($239M) and investment activity ($103M, thereof main part was maintenance works). We also note that in Y2017 Ferrexpo paid dividends to its shareholders in amount of $58M.
Cash balance at accounts of Ferrexpo decreased from $145M a year ago to $98M as of 31.12.17, general balance sheet structure as of reporting date looked as follows:
USD M
31.12.16
31.12.17
Total Assets
1 163
1 222
Fixed Assets
804
898
Current Assets
359
323
Equity
323
596
Debt
734
501
We specially note that because of significant debt repayment during last two years ($420M was repaid in total) Ferrexpo balance sheet structure and quality significantly improved.
As of 31.12.17 total gross debt of Ferrexpo was at $500M, while net debt was close to $400M.
In accordance with current debt repayment schedules in Y2018 Ferrexpo is to repay to its creditors about $320M of principal, in Y2019 – another $175M. Also the company decided (in case it will be approved by shareholders meeting) to pay in Y2018 $77M of dividends.
At the moment one of the largest factors of uncertainty for Y2018 are investments. If we assume that investments will remain at the level of previous year (the company plans to realize another pellet line refurbishment in Q2 2018, also Ferrexpo will continue to work upon new investment projects aimed to increase production capacity of the company), cash necessity in Y2018 is to make about $500M.
To finance this necessity the company is to utilize new PXF facility in amount of about $200M and (taking into account cash balance of $100M as of 31.12.17) needs to generate not less than $250M of operating cash inflow.
Taking into account the fact that pellets premium is to stay at record-high level for some period of time at least in short-term, necessary operating cash flow will be generated if average annual iron ore index value will be at around $50/t (all other items being equal to Y2017). If we consider that in Q1 2018 average index value was at $70-75/t, the company has rather good margin of safety to meet all its obligations.