30 November 2016
Financial performance of Kernel in Q1 FY2017 has been quite average with rather weak results in oilseeds crushing and grains trading segments. On the other side because of good harvest Farming segment has been demonstrating good performance (but with accelerated profits recognition, in addition part of crops is still not harvested). Balance sheet quality of the company remains good.
Key financials
USD k
Q1 2017
Q1 2016
Sales
384 063
377 722
EBITDA
72 400
55 100
EBITDA margin, %
19%
15%
Net Profit
63 072
24 071
Main business directions performance
USD M
Q1 2017
Q1 2016
Change, %
Oilseeds crushing
Sales
152.2
169.9
-10.4%
EBITDA
10.6
22.5
-53%
EBITDA margin, %
7.0%
13.2%
Grains trading
Sales
199.7
176.3
13.3%
EBITDA
4.3
10.4
-59%
EBITDA margin, %
2.2%
5.9%
Farming
Sales
146.4
56.2
160.5%
EBITDA
77.7
16.0
4.8x
EBITDA margin, %
53.1%
28.5%
Despite significant decline of crushing volumes in last reporting quarter (by 33% even vs. not the best from this perspective Q1 FY2016), Kernel managed to maintain its sunflower oils sales level in natural terms. The reason is that in Q1 FY2017 the company largely sold oil produced in Q4 2016 (when sales fell y-o-y by 30%). In money terms segment revenues declined vs. Q1 FY2016 by 10% because of lower average realization prices.
EBITDA margin of crushing segment declined to 7%, which is the lowest margin for the last years (and per our perception it is historically the lowest margin for the industry in Ukraine):
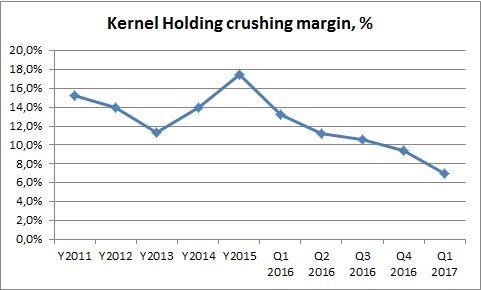
Taking into account current market situation (significant competition for raw materials due to increase of oilseeds crushing capacities in Ukraine and, possibly, activity of “grey” crushers), we expected margin decline vs. previous year (during last two years margin was inflated due to positive effect of UAH devaluation), however, factual decline exceeded our expectations. As a result segment’s EBITDA in Q1 FY2017 made just USD 10.6M (vs. USD 22.5M a year ago).
During its conference call with investors management of the company noted some expected increase in oilseeds crushing margin in Q2 and also projects that general decline of margin can lead to some consolidation of the industry. At least Kernel investment plans imply purchase of additional crushing facilities with total capacity of 1.5M tons.
Growth of realization volumes in grains trading in Q1 FY2017 made 1 182M tons, +27.5% y-o-y. Here we also note effect of low base (vs. Q1 FY2015 volume of grains export declined by 3%). In addition we see that in reporting period Farming division significantly (from USD 48M in Q1 FY2016 up to USD 140M) increased its Intragroup sales (which most likely supported grains trading business). On positive side here is high goods for resale stock on balance sheet of the company as of 30.09.16 (80.6M vs. 46.9M a year ago). It should support segments performance in next quarter.
Profitability of grains trading has also been low – EBITDA margin comprised just 2% - also the lowest level for the last period of time. We expected decline of grains trading margin in new season, but again factual decline was more significant vs. our expectations. Partially it could be connected with some inter-segment margin re-distribution as performance of Terminals segment improved – revenues grew by 34% (y-o-y, up to USD 12.4M), EBITDA – by 90% (USD 10.5M) despite increase of transshipment volume by 18% (main part of services are Intragroup).
At the moment it is already clear that because of good harvest Farming division will be main profits-generator of the Group in new financial year. Yields dynamics for last seasons look as follows (t/ha):
Season
2016/17
2015/16
2014/15
2013/14
2012/13
2011/12
Corn
8.8 7.3 7.1 5.5 4.6 7.1
Wheat
6.0 5.1 5.4 4.3 3.4 3.7
Sunflower seeds
3.0 2.7 2.5 2.1 1.7 2.1
Soybeans
2.8 1.8 1.8 1.4 1.3 1.9
In Q1 FY2017 total segment revenues made USD 146.4M (thereof USD 140M Intragroup, we estimate that approximately 30-35% of new season’s total harvest was realized by Farming segment in reporting quarter), reported EBITDA – USD 77.7M, in addition to USD 20.1M of gains from biological assets revaluation reflected in FY2016 financials. So total EBITDA related to new season makes almost USD 100M. Estimated by us Farming Division EBITDA for the whole season is USD 160-170M (with about 40% margin).
As of the date of report 10% of acreage harvesting for FY2017 is not completed. It means more than 20% of corn still remains in fields.
Balance Sheet structure
30.09.16
30.09.15
Total Assets
1 652 447
1 488 269
Fixed Assets
784 859
781 680
Current Assets
867 588
706 589
Inventory
539 922
403 074
Equity
1 030 198
895 012
Debt
415 427
457 348
Main y-o-y changes in Kernel assets structure related to higher Inventory and VAT Receivables volumes. As of 30.09.16 Inventory (including biological assets) made USD 540M vs. 403M a year ago, main reasons of increase - higher gains from biological assets revaluation, higher sunflower seeds stock and higher stocks of grains for resale (each of a/m factors accounts for about USD 30M of increase). VAT Receivables grew by close to USD 40M y-o-y, mainly as a result of changes in Ukrainian VAT legislation in Y2016.
Financing structure of the company remains quite good. After repayment of approximately 50% of its total debt portfolio in last two financial years (USD 400M in absolute terms), current Debt/Equity ratio of Kernel is close to 0.4x, Equity (USD 1 030M as of 30.09.16) exceeds Fixed Assets and is main source of assets financing in general, so financial position of the company is clearly good. In addition current adjusted Net Debt/EBITDA ratio Is close to 0.9x.
Popular on site:
Agrogeneration releases its financial report for 1H 2016
Industrial Milk Company reports Q3 2016 financials
MHP reports Q3 2016 financials