17 November 2016
Supported by growing export operations and good new season crops harvest, MHP demonstrated generally good results in last reporting period. Balance sheet structure remains average with good liquidity position on positive side.
Q3 2016 financial results
Key financials
USD k
Q3 2016
Q2 2016
Q3 2015
Sales
369 289
285 121
346 968
EBITDA
105 000
146 000
116 000
EBITDA margin, %
28.4%
51.2%
33.4%
Net Profit
-7 704
165 275
24 206
Due to growing export total MHP revenues in Q3 (USD 369M) increased by 30% vs. previous quarter and 6.4% vs. Q3 2015. Export sales made 54% of total at USD 200.7M.
Break-downs of realization by segment during last quarters looked as follows:
USD k
Q3 2016
Q2 2016
Q3 2015
Poultry
213 000
187 000
206 000
Vegetable Oil
78 000
69 000
57 000
Grains growing
42 000
1 000
50 000
Other
36 000
28 000
34 000
Almost all grains and vegetable oil sales to 3rd parties is export. As for poultry segment, basing on information from report, export accounted for 35% of total Q3 poultry realization in natural terms, we also estimate that export share in money terms was close to 40-42%. In addition we note that despite 18% decline y-o-y, at the moment average export price is by about 15% higher vs. average domestic realization price, probably, partially because of different product mix. In any case we estimate that average domestic price in USD terms in last reporting quarter decreased vs. Q3 2015 just by 3%, increasing in UAH terms by 15%.
Growth of vegetable oils realization was related to increase of sunflower seeds crushing volumes and to higher capacity utilization of new (launched in Y2015) soybeans processing complex (current capacity utilization is 80%, MHP became one of the largest soybeans crusher in Ukraine, in Q3 the company doubled y-o-y its soybeans oil sales).
In last reporting period MHP started realization of new season harvest crops. According to report wheat yield in current season made 6.4t/ha (6.0t/ha in MY2015/16), sunflower seeds yield – 3.4t/ha (3.1t/ha). Up the moment corn is harvested from 86% of total area, reported yield is 8.6t/ha (6.7t/ha a year ago, difference in money terms is close to USD 40M, corn accounts for about 40% of total area of the company). Basing on presented figures increase of segment’s profitability is expected.
Factually higher yields allowed the company to increase vs. previous year gain from biological assets revaluation (by the same USD 40M), so that profits for future harvest have been shown in Q2, please see quarterly breakdowns of EBITDA by segment during last reporting periods on the chart below:
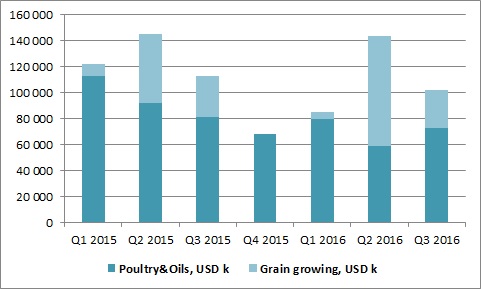
Taking into account expected EBITDA per 1 ha in new season at USD 360, total estimated EBITDA of grains growing segment in new season is USD 125M, main part of it already reflected in financials of the company.
9m 2016 results
Key financials
USD k
9m 2016
9m 2015
Change, %
Sales
898 824
897 963
0.1%
EBITDA
340 000
386 000
-11.9%
EBITDA margin, %
37.8%
43.0%
-
Net Profit
86 162
-36 990
n.a.
Total proceeds in 9m 2016 made close to USD 900M, on the level of previous year, with main contributing segments as follows:
USD k
9m 2016
9m 2015
Change, %
Poultry
545 000
544 000
0.2%
Vegetable Oils
218 000
171 000
27.5%
Grains growing
45 000
102 000
-56.0%
Other
91 000
81 000
12.2%
Decrease of grains sales to 3rd parties happened due to small stocks as of beginning of period driven by low yields of late crops in previous season.
Poultry realization in money terms have been stable, as decline of average realization price in USD terms by 7% was offset by growth of export (in tons) by 44% (while domestic realization in natural terms declined by 6%). Main objective of MHP at the moment is to develop export operations. Taking into account dominant positions of the company on domestic market, we have little concerns regarding MHP ability to take back its domestic market share.
Balance Sheet structure
30.09.16
31.12.15
Total Assets
2 145 184
2 075 733
Fixed Assets
1 403 499
1 338 812
Current Assets
741 685
736 921
Equity
771 381
672 849
Debt
1 237 516
1 302 668
As for general balance sheet structure of the company, following UAH devaluation (and still large domestic sales share in total revenues) it remains average (Debt/Equity is close to 1.6x, Equity/Fixed Assets – 0.55x), though main portion of debt is long-term, providing for good liquidity position – Current Ratio is 1.9x, so that in short-term period prospects of MHP are quite good. Principal shareholder has the same view, having paid USD 80M of dividends basing on Y2015 results (which we see as more negative factor than positive) despite worsening of balance sheet structure.
Popular on site:
Astarta reports financials for Q3 2016
Ovostar reports Q3 2016 financials
Kernel reports financials for financial year 2016