3 April 2018
Despite significant improvement of financial performance in Q4 2017, general Avangard results for Y2017 have been weak.
Due to growing shell eggs export, starting from H2 2017 operating performance of the company significantly improved. As a result, in the last quarter of Y2017 total shell eggs output made 706M eggs (+17% y-o-y), while for Y2017 as a whole it made 2 399M eggs (-4% y-o-y).
The share of Avangard in total Ukrainian industrial shell eggs output in Y2017 made 28.5%.
In Q4 2017 shell eggs sales in tons increased y-o-y by 27.5%, in Y2017 as a whole – by 23%. Along with it eggs processing volumes demonstrated twofold y-o-y decrease – despite falling sales of eggs products in Y2016 Avangard was forced to process significant portion of produced eggs just to avoid good spoilage. Due to low demand and eggs products prices decrease it led to significant overstocking (in Y2017 eggs products stock further increased).
General eggs production dynamics during latest quarters looked as follows:
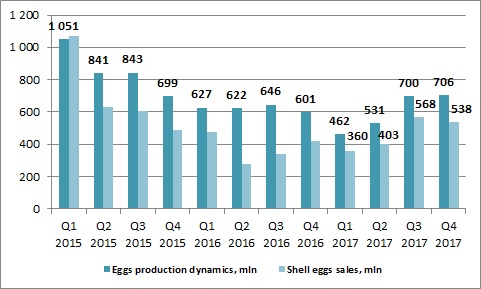
As was already noted Avangard shell eggs export volumes significantly increased starting from Q3 2017. Mainly as Iraq eggs market was re-opened for Ukrainian producers, in H2 2017 total export of shell eggs by Avangard made 455M eggs vs. 103M in H1 2017 and 122M in H2 2016.
So in Y2017 as a whole shell eggs export of the company comprised 558M eggs, by more than two times higher y-o-y. Along with it domestic sales remained relatively flat (at about 1 300M eggs).
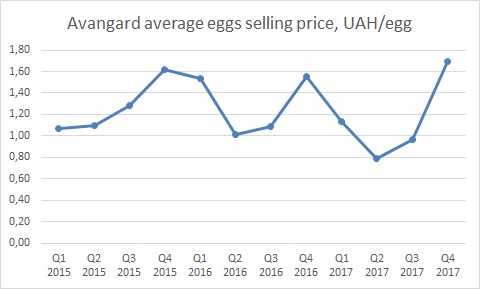
Average shell eggs selling price of Avangard in Q4 2017 made UAH 1.69/egg (+9% y-o-y), in Y2017 as a whole – UAH 1.17/egg (-13% y-o-y). Due to good Ukrainian shell eggs dynamics during the first months of Y2018, domestic shell eggs price remains at close to high levels of Q4 2017 (while in Q1 2017 it already started to decline after pure seasonal growth in Q4 2016).
Average shell eggs selling prices of Avangard during last period of time looked as follows:
Key financials for Y2017
USD M
Y2017
Y2016
Revenues*
118 115
141 136
EBITDA
11 991
1 635
EBITDA margin, %
10%
1%
Net Profit
-7 234
-56 487
Driven by y-o-y decline of average shell eggs selling price and decrease of eggs products sales, total Avangard revenues (disregarding grains trading) in Y2017 decreased vs. previous year by 16% to $118.1M.
On the other hand EBITDA increased from $1.6M in Y2016 up to $12M. Main factor of increase – state subsidies ($19.1M vs. $5.4M in Y2016) and reversal of bad debt (receivables) write-down in amount of $4.5M (in Y2016 write-down made $18.6M). Disregarding above-mentioned factors EBITDA of Avangard in Y2017 would be negative at -$11.6M (vs. positive value of $14M in Y2016). Main reason of significant underperformance – decrease of average selling prices for both shell eggs and eggs products (net cost according to Avangard presentation has been relatively stable).
We note that because of noticeable shell eggs selling prices growth in Q4 2017, EBITDA of the company (disregarding subsidy and reversal of losses related to bad debts) made about $6M. So, taking into account positive situation with Ukrainian shell eggs export, which translates into relatively high domestic prices, we can expect further improvement of Avangard financial performance at least in Q1 2018.
In Y2017 Avangard paid to its creditors just $3.5M of interest.
Balance Sheet structure
USD k
31.12.16
31.12.17
Total Assets
529 491
512 781
Fixed Assets
383 462
349 879
Current Assets
146 029
162 902
Inventory
69 899
72 461
Trade Receivables
40 628
45 376
Cash
12 570
18 242
Equity
138 810
84 521
Debt
352 129
391 122
Main changes in assets structure during reporting period referred to decrease of Inventories by $6M (due to decrease of grains for resale, while stock of finished goods (mainly eggs products) increased by $8M) and decrease of prepayments and other current assets (by $5M). Along with it cash balance of Avangard by 31.12.17 grew up to $18M (vs. $12.5M a year ago).
General balance sheet structure of the company remains weak. From one side, taking into account current profitability of operations, we have significant doubts regarding Avangard fixed assets valuation (balance sheet value - $350M).
As of 31.12.17 formal Equity of the company makes about USD 85M. Taking into account above-mentioned uncertainty with fixed assets valuation, we can estimate that in reality Equity of Avangard is negative, assets of the company and its activity is fully financed by debt.
As of reporting date total debt of Avangard (including capitalized interest expenses) comprised $391M, at the moment the company keeps negotiations with its creditors on debt restructuring (which factually implies debt hair-cut).
Popular on site:
>Ukrainian grains market 2017