16 January 2017
Ukrainian Y2016 agri-commodities export digest
In Y2016 Ukrainian export of sunflower oil and meal in money terms made almost USD 4.456bln, which is about 12% of total Ukrainian export. Growth vs. previous year was 17%.
Along with it value of sunflower oil and meal Ukrainian export in last year was not record-high for the modern history of Ukraine – in Y2014 export value of sunflower seeds processing products in money terms made USD 4.489bln. Though in natural terms (tons) sunflower oil export in Y2016 (4.8M tons) was by 23% higher than in previous year and by 11.5% higher than in Y2014.
Taking into account current projections for Ukrainian sunflower oil export in current season (September’16 – August’17) at 5.2-5.3M tons, we can expect record-high export of sunflower seeds processing products in Y2017 both in natural (tons) and money (USD) terms.
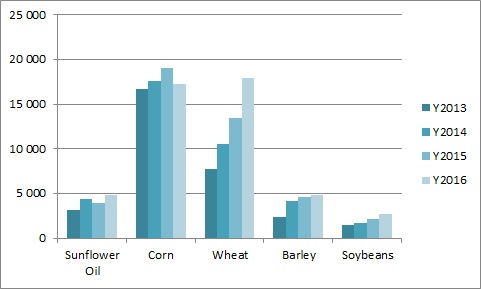
In line with harvest dynamics (relatively low harvest in Y2015, so low supply in H1 2016), in Y2016 Ukrainian corn export declined vs. previous year. For wheat and soybeans dynamics is positive: Ukrainian wheat harvest was good in two last years, while export of soybeans was much more active in Q4 2016, after record-high soybeans crops collected in current season.
Because of good corn harvest of Y2016 we can expect increase of corn export figures in Y2017, while for wheat, barley and soybeans dynamics will largely depend on crop of new season.
Ukrainian export figures for main agri-commodities in natural terms (k tons) during last four years are represented on the following chart and in the table below:
k tons
Y2013
Y2014
Y2015
Y2016
Change in 2016/2015, %
Sunflower Oil
3 209
4 344
3 938
4 842
23.0%
Sunflower Meal
2 873
3 918
3 687
4 105
11.3%
Rapeseeds
2 347
2 036
1 435
994
-30.7%
Soybeans
1 492
1 676
2 199
2 736
24.4%
Soybean Oil
82
122
154
153
-0.6%
Soybean Meal
21
144
262
334
27.5%
Corn
16 729
17 558
19 049
17 286
-9.3%
Wheat
7 762
10 545
13 454
17 922
33.2%
Barley
2 339
4 169
4 629
4 802
3.7%
As for prices dynamics, weighted-average export price in Y2016 declined vs. previous year by 4.9%, largest contributors were wheat (its average export price decreased by 9%, while the share in total export is 20%, so influence on general figure is large), barley (price fell by 16.5%, though its share in total export is less than 7%, so impact on final result is restricted) and sunflower meal (the same situation as for barley – price declined by 14%, but its share in total export is 7%). Factually apart from soybean oil, average price of each type of presented commodity decreased in Y2016, results are presented in table below:
USD per 1 ton
Y2013
Y2014
Y2015
Y2016
Change in 2016/2015, %
Sunflower Oil
1 022
820
769
765
-0.5%
Sunflower Meal
270
237
214
183
-14.4%
Rapeseeds
510
429
397
394
-0.7%
Soybeans
497
421
367
360
-1.8%
Soybean Oil
902
787
695
725
4.4%
Soybean Meal
571
509
393
347
-11.7%
Corn
229
191
158
154
-2.8%
Wheat
244
217
166
152
-8.9%
Barley
246
203
166
139
-16.5%
Interesting to note is that if we compare export prices for Ukrainian agricultural commodities in Y2016 vs. Y2013 (world agri-commodities prices started their downward cycle in H2 2013), the largest fall was demonstrated by barley (-43.6%), soybean meal (-39.2%) and wheat (-37.7%). Better dynamics was shown by oilseeds: sunflower oil (-25%), soybeans (-27%) and rapeseeds (-23%).
Results for Ukrainian agri-commodities export during FYs2013-2016 in money terms (USD M) are represented in following table:
USD M
Y2013
Y2014
Y2015
Y2016
Change in 2016/2015, %
Sunflower Oil
3 281
3 560
3 028
3 705
22.4%
Sunflower Meal
776
929
788
751
-4.7%
Rapeseeds
1 197
873
570
392
5.0%
Soybeans
742
705
807
986
22.2%
Soybean Oil
74
96
107
111
3.7%
Soybean Meal
12
58
103
116
12.6%
Corn
3 833
3 356
3 008
2 654
-11.8%
Wheat
1 891
2 293
2 239
2 718
21.4%
Barley
575
845
769
666
-13.4%
Grains
6 299
6 494
6 016
6 038
0.4%
Oilseeds
6 131
6 265
5 424
6 137
13.1%
TOTAL
12 430
12 759
11 440
12 175
6.4%
Popular on site:
Ukrainian sugar market - new perspectives
Ukrainian soybeans market is ready for new records
Ukrainian Agri-Market