7 November 2017
Expectedly financial performance of Metinvest in reporting period has been good.
Key Financials
USD M
H1 2017
H1 2016
Revenues
3 913
2 880
EBITDA
839
580
EBITDA margin, %
21%
20%
Net Profit
72
90
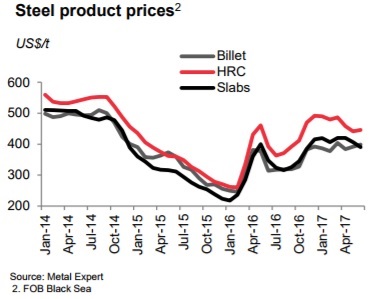
Total Metinvest proceeds in H1 2017 amounted to USD 3.913bln, by 36% higher y-o-y. Main factor of growth – significant increase of steel and iron ore prices. In reporting period pig iron prices grew y-o-y by 61%, slab prices – by 58%, flat products – by 46%. Increase for iron ore products has been even more significant. According to Metinvest report steel products prices dynamics (FOB Black Sea) during last years looked as follows:
In sales structure finished steel products made 59% (mainly flat products), semi-finished production comprised 12%, while the share of iron ore was at 16%.
In reporting period Metinvest EBITDA amounted to USD 839M vs. USD 580M in the same period of Y2016. Main growth factors – above-mentioned selling prices increase and UAH depreciation influence on net cost of production. We note negative influence on operating profitability of the group current assets write-down in amount of USD 92M as in March Metinvest lost control over enterprises situated at non-controlled by Ukrainian government Donbass territory (total loss from assets write-down in reporting period made USD 515M).
As a reminder in Y2016 significant negative impact on profitability of Metinvest activity made receivables write-down in total amount of USD 227M (due to significant past-dues from some key off-takers), but we note that there have been no such write-downs in H1 2016 (all write-down took place in the second half of the year).
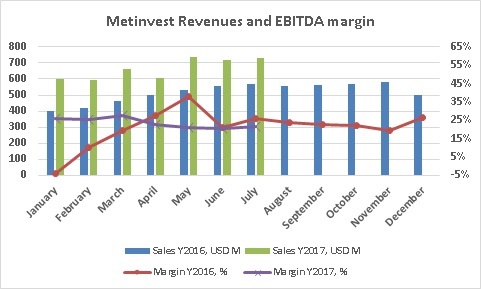
Metinvest revenues and EBITDA margin dynamics since the beginning of Y2016 look as follows:
Key financial performance figures break-downs by segment looked as follows:
USD M
H1 2017
2016
2015
2014
2013
Metallurgical division
Sales to 3rd parties
3 165
5 027
5 407
8 192
9 726
EBITDA
205
737
486
1 123
274
Mining division
Sales to 3rd parties
748
1 196
1 425
2 415
3 080
EBITDA
729
548
88
1 754
2 252
Metallurgical division
Total Metinvest crude steel output declined y-o-y by 6% to 3.9M tons, reason – loss of control over EMZ, disregarding this fact steel production grew by 13%:
Crude steel output, k tons
H1 2017
H1 2016
2016
2015
2014
2013
Azovstal
2 166
1 809
3 705
3 206
3 599
4 468
MMKI
1 488
1 427
2 736
2 645
3 544
5 035
EMZ
269
951
1 952
1 818
2 062
2 888
In H1 2017 Metinvest enterprises produced 2.131M tons of coke. Out of this volume 1.067M tons have been produced at Avdeevka coke plant (vs. 1.224M tons in H1 2016, decrease due to unstable plant operations as a result of military conflict escalation in February-March of current year), 648k tons – at Azovstal (578k tons a year ago), 416k tons – at Zaporizhkoks (387k tons). The group declares that at the moment it is self-sufficient with own coke production by 120% (disregarding EMZ and also Zaporizhstal, co-owned by Metinvest).
Total Metallurgical segment revenues (disregarding Intragroup sales) in reporting period made USD 3.165bln, +38% y-o-y. Reason – growth of average selling price, while in natural terms (tons) sales declined.
Sales of flat products comprised 63% of total segment’s revenues. As for geography of sales, the share of Ukrainian domestic market made 21%, European market – 38%, MENA – 20%, CIS countries – 11%. In the nearest future we can expect decrease of European market share due to recent imposition of import duties for hot-rolled products from the side of EU.
Due to significant growth of iron ore and coking coal (main constituents of steel products net cost) prices, division’s profitability decreased y-o-y. EBITDA (disregarding above-mentioned write-off current assets write-off) made USD 286M (with margin of 9%) vs. USD 401M in H1 2016 (when margin made 17%). Along with it, decline in Metallurgical segment profitability was more than offset by growth of margin for Mining operations.
Mining division
Despite significant decrease of iron ore production (-14% y-o-y), total revenues of Mining division in reporting period comprised USD 1.789bln (+81% y-o-y). Disregarding Intragroup sales, segment’s net sales made USD 748M (+27%). EBITDA margin of Mining division in H1 2017 made 41% (in H1 2016 – 26%).
Main driver of performance improvement – significant growth of iron ore prices, along with it, as a result of loss control over Krasnodonugol, self-sufficiency of the group in coking coal decreased to just over 40% (the only remaining asset here is US-based United Coal). So significant increase of global coking coal prices in the beginning of Y2017 did not materialize into Metinvest profits.
Balance Sheet structure
USD M
31.12.16
31.06.17
Total Assets
9 331
9 700
Fixed Assets
6 558
6 364
Current Assets
2 773
3 336
Equity
4 028
4 144
Debt
2 969
2 949
As for balance sheet structure of Metinvest, main changes in assets structure during reporting period were related to 1) write-down of the assets situated at non-controlled by Ukraine territory of Donbass; 2) increase of Receivables (+USD 400M) and Payables (+USD 295M).
Operating cash flow of the company (before interest and income tax paid) made USD 414M, which has been much lower than EBITDA (disregarding write-downs and EBITDA of JVs in H1 2017 it made USD 752M). Main reason – above-mentioned receivables growth. Mainly operating cash flow has been directed to investment activity (USD 179M).
Additional very important for Metinvest event – in H1 2017 the group finished its debt restructuring.
As a result of the agreement with creditors three issues of the group's Eurobonds maturing in 2016, 2017 and 2018 were annulled, instead of which new Eurobonds worth USD 1.2bln with maturity date in late 2021 were issued. In addition, four contracts on syndicated pre-export financing credit lines were set out in a new wording, which foresees the abolition of defaults and other liabilities on these lines. The new version, among other things, provides for the unification of the four credit lines into one worth USD 1.1bln maturing in mid-2021.
All reports
All about Metinvest
Popular on site:
Kernel Holding - operating results for Q1 FY2018
Ferrexpo reports its production for Q3 2017
Avangard H1 2017 financial report