Metinvest Holding is one of the largest Ukrainian companies, a vertically integrated producer of iron ore, coking coal, and steel with assets in Ukraine, Great Britain, the USA, and the EU.
![]()
Metinvest today
By 2022, the group belonged to the TOP-50 largest steel companies in the world, producing about 15 million tons of steel per year (taking into account DMK/Kametstal, which officially was purchased by Metinvest in July 2021, as well as the Zaporizhstal steel mill, in which Metinvest owns 50 %, and still does not consolidate its output into the total production of the group).
After the Russian occupation of Mariupol, Metinvest lost its main metallurgical plants - Azovstal and Mariupol Metallurgical Plant (MMK), the total combined volume of steel production at which in 2021 was 8.6 million tons (40% of the total steel production in Ukraine).
Therefore, as of the end of 2023, the group includes only one metallurgical enterprise that smelts iron and steel - Kametstal (the city of Kamianske), in addition, the group continues to own a 50% stake in Zaporizhstal.
In addition to steel production facilities in Ukraine, Metinvest also owns rolling mills in Bulgaria (Promet Steel), Italy (Ferriera Valsider, Metinvest Valsider) and Great Britain (Spartan UK).
Iron ore is produced by three enterprises of the group - Northern, Central and Ingulets GOKs, as well as Southern GOK (in which Metinvest owns 46%). All of them are located in Kryvyi Rih, Dnipro region.
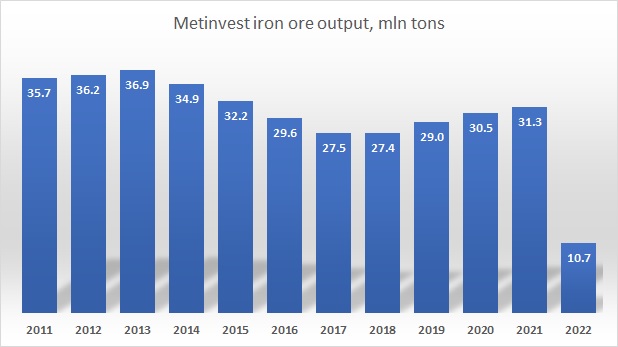
The total output of iron ore concentrate by the group (not including the production of Southern GZK) in 2021 amounted to 31.3 million tons, Metinvest was among the TOP-10 producers of iron ore in the world.
In 2022, because of significant decrease of iron ore exports due to the blockade of Ukrainian Black Sea ports, the shutdown of the Mariupol metallurgical plants, as well as a decrease of output at other steel mills, Metinvest iron ore production also decreased significantly, amounting to 10.7 million tons.
Coking coal is mined by the group at the American United Coal Company, as well as at the Ukrainian enterprise Pokrovske Coal (operational control was obtained in March 2021). The total volume of coal production by the group in 2022 was 5 million tons.
Currently, after the shutdown of the Avdiivka Coke (which until 2022 was the largest producer of coke in Europe), the main coke producers of the group are Zaporizhia Coke and Kametstal (on the basis of the Dnipro Coke). The total production of coke by Metinvest in 2022 was 1.6 million tons (-64% vs. 2021).
As of the end of 2023, the owners of the group are Rinat Akhmetov's SCM (75% - 1 share), Vadym Novinsky's Smart Holding (25% + 1 share).
Formation and growth (2006-2013)
The Metinvest group was officially created in 2006 and united the iron ore and metallurgical assets owned by Rinat Akhmetov - Northern and Central GOKs in Kryvyi Rih, Avdiivka Coke, Azovstal and Yenakievo Steel Mill, as well as Khartsyzsk Pipe Plant.
In 2007, Metinvest acquired the metallurgical assets of Vadym Novinsky's Smart Group (Ingulets GOK, Makiivka Metallurgical Plant and Bulgarian Promet Steel). Instead, Smart Holding received a 25% stake in Metinvest (75% remained owned by Akhmetov�s SCM).
This merger led to the fact that the production of iron ore concentrate in Ukraine was largely (by almost 70%) concentrated in one hand. As for other producers, Ferrexpo and its Poltava GOK were 100% export-oriented, while iron ore mines of Kryvorizhstal (Arcelor Mittal) covered only this plant's own needs.
Other large Ukrainian metallurgical companies - MMK named after Ilyich (which at that time was owned by Volodymyr Boyko), Zaporizhstal and the ISD group (which at that time owned the Alchevsk and Dnipro metallurgical plants) - were left without alternative sources of iron ore raw materials inside Ukraine.
So all these producers were forced to either import iron ore or buy it from Metinvest at a price close to the import parity. This led to a significant deterioration in the financial performance of mentioned enterprises after the financial crisis of 2008�09. As a result of the crisis, the prices of both iron ore and steel fell, but the subsequent recovery was uneven - the profitability of miners in 2010 reached 60% (EBITDA margin), while the operating profit of steelmakers was close to zero.
Logically, as a large iron ore producer, in such a situation Metinvest performed well, while ISD, Zaporizhstal and MMK named after Ilyich had huge financial issues. As a result, already in 2010, MMK was absorbed by Metinvest, and in 2011-12 a 50% stake in Zaporizhstal was also bought by the group (practically immediately, Metinvest received operational control over the plant).
This way Metinvest was building a vertically integrated business model, the only drawback of which was insufficient production of own coking coal (in general Ukraine had certain deficit of coking coal at that time).
This need was partly covered by the purchase in 2009 of the American producer of coking coal - United Coal Company. As a result, two assets of the group - United Coal Company and Krasnodonvugilya, which was located in Donbas - covered about two-thirds of the group's coal needs in 2010-2011).
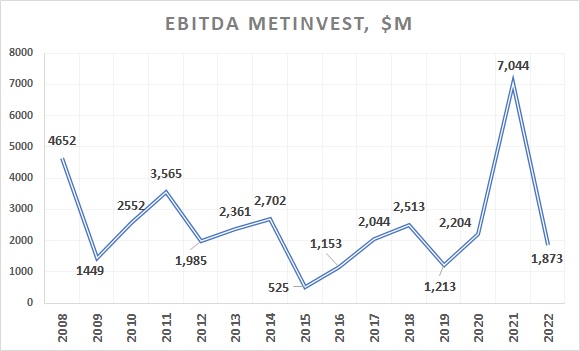
The financial results of the group during 2006-2013 were very good:
The first phase of the war (2014-2017)
Since the beginning of 2014, the conflict in the east of Ukraine, as well as a significant decrease in world prices for iron ore and steel, which from 2014 to the beginning of 2016 have fallen to the lowest level in ten years, had a significant impact on the company's general activity and financial results.
For example, the average world price of iron ore in 2016 was three times lower than in 2012-2013).
Metinvest's production facilities, located in the Donetsk and Luhansk regions, were significantly affected by the military operations in Donbas. Part of the group's assets � the Yenakievo Steel Mill, Krasnodonvugilya, as well as the Khartsyzsk Pipe Plant � remained on the territory of the so-called DNR and LNR, which Ukraine no longer controlled.
Even at that time, the Avdiivka coke plant was working under shelling for a significant part of the time and was far from operating at full capacity.
In addition to this, as a result of the hostilities, railway station in Volnovakha, important for Metinvest, was significantly damaged, as well as access to the stations in Debaltseve and Yasynuvata was lost. The group was forced to look for alternative ways to deliver raw materials to Avdiivka and Mariupol.
Problems in operational activities were also reflected in the financial results of Metinvest. In 2015, the company's EBITDA fell to a record low of $525 million.
In 2016, thanks to the Chinese government's measures to stimulate its economy (China produces and consumes more than a half of all the world's steel), global steel and ore prices began to recover, and with this, Metinvest's performance started to improve.
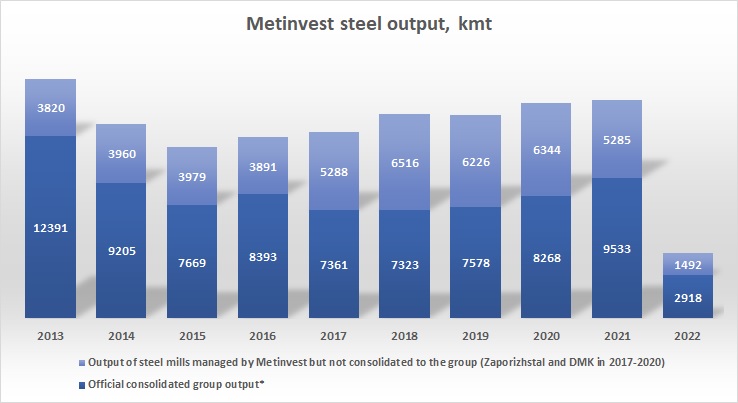
*- as its consolidated output Metinvest reports steel production at MMKI, Azovstal, Yenakievo Steel Mill (until 2017) and DMK/Kametstal since mid-2021, while output at Zaporizhiastal (Metinvest owns 50% of the plant and carries out its operational control since 2012), as well as at DMK from 2017 to mid-2021 (under the operational management of Metinvest at those time) were not included in the total production according to the group's official reports.
In 2017, Metinvest gained control over the operational activities of the Dnipro Metallurgical Combine (DMK). The plant belonged to the ISD group (the main shareholder of which was the Russian state-owned Vnesheconombank), but had a significant overdue debt to Metinvest for iron ore.
Metinvest finally became the owner of the property complex of DMK in 2021 (the plant received a new name - Kametstal).
Due to the loss of Krasnodonvuhillia, Metinvest's supply of coking coal of its own production worsened. Krasnodon coal mine produced 2.8 million tons of coal in 2013, so as a result of its loss, the total production of coking coal by Metinvest decreased from 5.5 million tons in 2013 to 2.5 million tons in 2017.
This decrease was partly offset by the maximization of production at United Coal in the USA, as well as the acquisition in 2018 for $190 million of a stake of about 25% in Pokrovske Coal, a Ukrainian producer of coking coal that was owned by the Donetskstal group of Victor Nusenkis.
Metinvest also received an option to fully buy out the enterprise, which was exercised at the beginning of 2021. In 2017, Metinvest also completed the restructuring of its debt, which began in early 2015 (at the end of 2014, the group's total debt was about $3.2 billion). The maturity dates of most of the group's obligations were postponed from 2015-2018 to 2021.
Later, in 2018-2020, taking advantage of the favorable global financial markets situation, Metinvest refinanced its obligations, extending the payment term of the main ones until 2025-2029.
Growth and a record year (2018-2021)
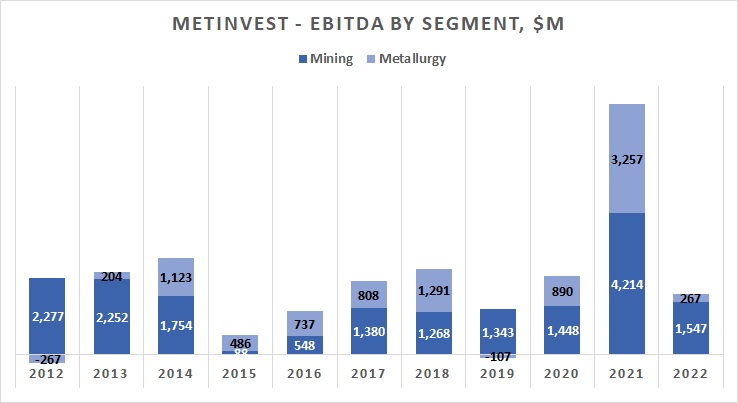
During 2017-20, operating and financial performance of Metinvest remained relatively stable. The group's EBITDA ranged from $1.2 billion (in 2019) to $2.5 billion (2018). The Mining segment (in fact, Metinvest's GOKs producing iron ore) generated two-thirds of the profits in these years.
The main production figures of the group (output of iron ore, coal and coke) were also stable. Only the production of steel by the Mariupol plants gradually increased due to the solution of logistical problems with the supply of raw materials to the steel mills.
Fears of the negative impact of the coronavirus pandemic on the entire global market of steel products and, accordingly, the activities of Metinvest, did not come true.
The pandemic had a negative impact on the overall global consumption of steel products, however, firstly, China even managed to increase its consumption compared to previous year, and secondly, unprecedented measures to support the economy by the governments of all the leading countries in the world led to periods of rapid price growth for major commodities, including iron ore and steel.
2021 was the best year for the group in its entire history.
Due to a significant increase in world prices for iron ore (for ore with an iron content of 62% on the basis of CFR China by an average of 47% y-o-y) and steel (for HRC on the basis of FOB Black Sea by an average of 84% y-o-y), financial performance of the company improved significantly compared to all previous years.
Metinvest's revenue increased by 72% compared to the previous year to $18 billion, EBITDA made $7 billion (more than the three previous years combined), net profit - $4.8 billion, operating cash flow (after interest and income tax) - $5.5 billion.
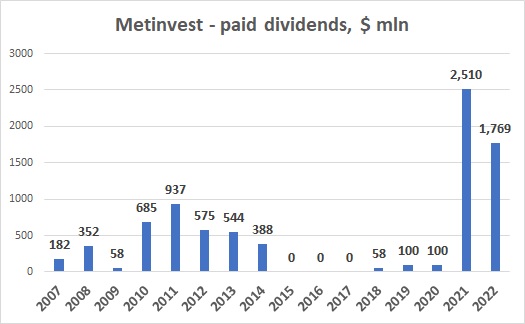
Of these funds, the company allocated $2.5 billion to pay dividends to its shareholders, $1.2 billion to debt reduction, and another $1.3 billion to capital investments.
Among the important investments of 2021, Metinvest purchased the assets of DMK for $341 million (the average steel production at the plant during 2018-2020 was 2.5 million tons, while the total capacity was 3.2 million tons per year), $446 million was directed to the purchase of a 75% stake in Pokrovske Coal (covering a significant part - although not 100% - of the group's needs for coking coal).
As of the end of 2021, the amount of cash on Metinvest's balance sheet was $1.2 billion.
Full scale invasion
Having received large profits and invested a significant amount in 2021, at the beginning of 2022, Metinvest announced significant further investment plans (about $1.2 billion) for the new year as well.
Also, already in 2022, Metinvest paid out $1.7 billion to shareholders (so, in general, during 2021-2022, the amount of dividends paid to shareholders amounted to $4.3 billion, another $415 million were dividends payable as of the end of 2022).
In the beginning of Y2022 Metinvest's expectations for the coming years were very optimistic, but a full-scale Russian invasion changed everything.
The tragedy in Mariupol, the heroic defense of Azovstal by the Ukrainian defenders, the Russians' attempt to capture Avdiivka - all this was on the front pages of almost every mass media during 2022-23.
From a business point of view, the loss of Mariupol costed Metinvest 8.6 million tons of steel output per year, operations of Europe's largest coke plant in Avdiivka were stopped as well.
The blockade of Ukrainian Black Sea ports, a drop in domestic consumption of rolled metal by 63%, shelling of the Ukrainian energy infrastructure led to a significant decrease in output at those Metinvest enterprises that remained in the territory controlled by Ukraine.
Steel production at Zaporizhstal in 2022 decreased by 60% compared to the previous year (production at Zaporizhstal is not consolidated into the overall group figures), at Kametstal (DMK) - by 36%. The production of iron ore concentrate fell by 66%, but coking coal output decreased by only 10%.
Accordingly, due to the lack of raw materials, the production volume at Metinvest's European plants decreased by 20% (the total volume was 1.36 million tons).
The revenue of Metinvest in 2022 amounted to USD 8.3 billion, EBITDA - USD 1.9 billion (at the same time, the group's net loss due to the write-off of assets because of the war was $2.2 billion).
During 2022, despite the full-scale war, Metinvest generated $1.4 billion in operating cash flow, which was directed primarily at payment of dividends to shareholders.
The investment program was significantly reduced - from $1.3 billion in 2021 to $300 million.
The group and its owners benefited from the refinancing of the loan portfolio that took place in previous years, as a result of which the main debt payments of the group fall on the years 2025-2027.
In 2022, about $100 million was directed for debt repayment (an additional $161 million was interest paid on loans). The amount of the group's cash during 2022 decreased from $1.2 billion to $350 million.
Speaking about the preliminary results of Metinvest for 2023, we note, first of all, the relative stabilization of production figures. In the first nine months of the year, the Kametstal plant increased steel output by 11%, and Zaporizhstal - by 44%.
During the same period, iron ore production decreased by 23%, but during the year 2023 itself, the quarterly dynamics are positive.
With the gradual opening of exports through Ukrainian deep-sea ports in October-November, we can (if the export program continues) expect a gradual further increase in output figures - firstly of iron ore, and then of steel.
For the first half of 2023, Metinvest's EBITDA amounted to $487 million (it can be expected that for the whole of 2023 EBITDA will make more than $1 billion, which is higher, for example, vs. Y2015 and is close to the values of 2016 or 2019), operating cash flow - $313 million (the difference vs. EBITDA is mainly due to interest paid and income tax).
The generated cash flow was partly directed to the payment of financial obligations ($176 million), and another $141 million - to current maintenance investments.
Taking into account the long-term structure of Metinvest debt, today the company's overall financial standing can be considered as quite satisfactory.
Output, mln tons
| 2022 | 2021 | 2020 | 2019 | |
|---|---|---|---|---|
| Iron ore | 10.7 | 31.3 | 30.5 | 29.0 |
| Coking coal | 5.0 | 5.5 | 2.9 | 3.0 |
| Steel* | 4.4 | 14.8 | 14.6 | 13.8 |
*-taking into account production of steel mills controlled by the group, but which are not part of officially consolidated figures.
Key Financials
| $ mln | 2022 | 2021 | 2020 | 2019 |
|---|---|---|---|---|
| Revenue | 8 288 | 18 005 | 10 453 | 10 757 |
| EBITDA | 1 873 | 7 044 | 2 204 | 1 213 |
| Net Profit | -2 193 | 4 765 | 526 | 341 |
| 31.12.22 | 31.12.21 | 31.12.20 | 31.12.19 | |
| Assets | 8 785 | 15 980 | 13 454 | 13 837 |
| Fixed Assets | 5 595 | 10 578 | 8 275 | 9 323 |
| Current Assets | 3 200 | 5 402 | 5 179 | 4 514 |
| Inventory | 912 | 1 543 | 937 | 1 185 |
| Cash | 349 | 1 166 | 826 | 274 |
| Equity | 2 870 | 7 970 | 6 496 | 6 930 |
| Debt | 2 077 | 2 242 | 2 937 | 3 032 |
| 2022 | 2021 | 2020 | 2019 | |
| Operating cash flow | 1 403 | 5 526 | 1 740 | 814 |
| Financing cash flow | -1 877 | -3 841 | -360 | 123 |
| Dividends | -1 769 | -2 510 | -100 | -100 |
| Investing cash flow | -302 | -1 297 | -824 | -943 |