2 May 2017
Supported by growing domestic prices in the last quarter of Y2016 financial results of Ovostar have been rather good. Having good balance sheet quality, the company has good margin of safety in its activity.
Despite y-o-y decrease of eggs prices in both UAH and USD, Ovostar showed good revenues dynamics in both Q4 and Y2016 as a whole. Profitability expectedly declined, but remains much higher vs. Ukrainian competitors.
Q4 2016 financial results
Key financials
USD k
Q4 2016
Q4 2015
Change, %
Sales
24 075
22 829
5.5%
EBITDA
9 900
10 530
-6.0%
EBITDA margin, %
41%
46%
-
Net Profit
10 314
9 618
7.2%
Shell eggs sales in natural terms in Q4 2016 comprised 288M pieces, by 40% higher y-o-y. We note that despite clear focus of the company on export operations, domestic sales dynamics has also been good – in reporting quarter they increased vs. Q4 2015 by 46% up to 218M. Export shell eggs realization amounted to 70M pieces (+23% y-o-y, the share of export in total shell eggs sales during reporting quarter made 24%).
We especially note importance of domestic realization growth as Ukrainian retail shell eggs prices significantly grew in October and in Q4 average Ovostar eggs realization price made UAH 1.67/egg vs. UAH 1.16/egg in Q3 (though price remained lower than in Q4 2015 when it made UAH 1.77/egg). Average quarterly realization prices dynamics of the company (and its profitability in corresponding quarters) during last period of time looked as follows:
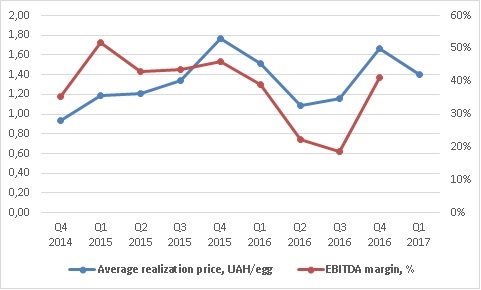
In Q4 2016 EBITDA margin of Ovostar operations made 41% (still below 46% reported in Q4 2015, but significant growth vs. Q3 figure, when EBITDA margin made 18.7%). Taking into account latest Ukrainian shell eggs retail prices dynamics we expect decline of average realization price (according to latest operating report average realization price of Ovostar in Q1 2017 made UAH 1.4/egg) and, correspondingly, margin in following quarters. However as Ovostar clearly relates to the most efficient companies of Ukrainian eggs industry we do not see significant problem for further development of the company related to ongoing prices decrease.
In addition, as for Ukrainain domestic market, we note that Ovostar has strong brands with rather good loyalty of the customers, so its average realization prices exceed those of main part of competitors (which leads to higher profitability vs. competitors).
In general operating results of the company for Q1 2017 looked as follows:
Q1 2017
Q1 2016
Change, %
Shell eggs production, mln
404
317
28%
Shell eggs sales, mln
276
201
37%
Eggs exported, mln
82
69
18%
Eggs processed, mln
99
94
5%
Total shell eggs production in reporting period made 404M pieces (+28% y-o-y). Sales volume grew by 37% up to 276M eggs, out of which 82M pieces were export (+18% y-o-y, despite the restrictions on import imposed by a number of countries due to the avian influenza cases detected in south-west of Ukraine in December 2016-January 2017). Volume of shell eggs processed in Q1 increased y-o-y by 5% to 99M eggs (driven by good sales dynamics of dry products).
Y2016 results
Key financials
USD k
Y2016
Y2015
Change, %
Sales
77 740
75 606
2.8%
EBITDA
24 100
34 800
-30.7%
EBITDA margin, %
30%
46%
-
Net Profit
22 533
31 944
-29.5%
As for the whole Y2016, revenues of the company made USD 77.7M, which has been slightly above of previous year level. Export sales in money terms increased y-o-y by 11% up to USD 24M (31% of total revenues). Main export destinations were Middle East (USD 19M, flat y-o-y) and EU (USD 4.9M vs. USD 1.4M in Y2015).
72% of Ovostar revenues in Y2016 accounted to shell eggs segment, 27% - to egg products segment. Sales of shell eggs in natural terms made 1 054M eggs (+22% vs. previous year), thereof export – 307M eggs (+34% y-o-y). Average realization price for shell eggs in national currency made UAH 1.35/egg, by 2% lower vs. Y2015, however we note that in USD terms y-o-y price decline made more than 15%.
50% of total shell eggs sales of Ovostar made branded products, 21% - unbranded, 29% - export realization.
In Y2016 EBITDA margin of the company made 30% (46% a year ago), main reason – above-mentioned decline of prices in USD terms. In addition, due to changes in VAT tax regime, Ovostar lost about USD 3.6M of Y2015 profits.
Net operating cash flow of Ovostar in Y2016 made USD 22.5M (vs. EBITDA of USD 24.1M, which confirms earnings of the company quality) and was mainly directed to new investments (USD 17.1M). In addition Ovostar repaid USD 4M of its loans.
As for investment program realized by the group (which is aimed to increase shell eggs output up to 2.0bln eggs in FYs2018-2019), according to report at the moment it’s completed by 60%. Ovostar plans to produce 1.7bln eggs in Y2017 (+15% vs. Y2016).
Balance Sheet structure
31.12.16
31.12.15
Total Assets
110 003
100 718
Fixed Assets
65 016
59 556
Current Assets
44 987
41 162
Equity
88 404
78 507
Debt
15 275
17 032
Balance sheet structure and quality of Ovostar remains good, as debt burden is low, the company has very good margin of safety in its activity.
Popular on site:
Due to low eggs products export Ukrainian eggs prices face additional pressure
Ovostar - Q4 2016 operating report
Ukrainian oilseeds export digest – March 2017