19 March 2017
After sharp drop a week ago iron ore price rebounded to over USD 90/t again driving up Ferrexpo quotations; moderately positive week for other Ukrainian public companies.
Stocks
Largest Ukrainian companies share prices weekly dynamics
Company
Currency
Price
Weekly change, %
Monthly change, %
Capitalization, USD M
MHP
USD
9.32
0.8%
3.6%
985
Kernel
PLN
74.7
1.6%
-3.6%
1 495
Ferrexpo
GBx
171.5
16.8%
0.1%
1 252
Astarta
PLN
69.0
3.0%
14.1%
433
Ovostar
PLN
92.3
-0.7%
0.8%
139
IMC
PLN
9.4
1.2%
4.4%
74
Rebound of Chinese steel and iron ore indexes led to growth of Ferrexpo share price by almost 17% during reporting week. Now its quotations (GBX 171.5 per share) are at the highest for the last three years level, while market capitalization is USD 1 252M.
Ferrexpo is to publish its Y2016 financial report on March 22, we estimate that annual sales of the company will reach about USD 1bln, EBITDA – USD 365M. It has been already reported that cash position of Ukrainian iron ore pellets producer as of 31.12.16 stood at USD 145M. In addition, taking into account that average iron ore price index since the beginning of current year made about USD 85/t (vs. USD 59/t on average in Y2016), we expect that monthly EBITDA of Ferrexpo in Q1 2017 is to make not less than USD 50M, which is very good result (almost two times better than on average in Y2016).
In Y2017 Ferrexpo is to repay about USD 200M of its debt principal, in Y2018 – close to USD 320M, so current performance is very important for future financial stability of the company.
MHP published its financial report for Y2016 on Wednesday, results have been generally good with booming chicken export and good profitability of poultry operations, despite still rather weak global market. Decent results have been also shown by Farming direction, driven by relatively good grains and oilseeds yields in current season. Despite acceptable results shown, MHP share price has little changed during reporting week, current market capitalization of the company remains at about USD 985M.
Ukrainian companies quoted in Warsaw have also grown. Growth of Astarta and Kernel (latter is to purchase part of Glencore assets situated in Ukraine, which will allow the largest Ukrainian sunflower oil producer to increase its land bank) share prices by 3% and 1.6% correspondingly led to increase of WIG-Ukraine by 2.5%. At the moment value of index is close to the highest level since the beginning of Y2013.
Commodities
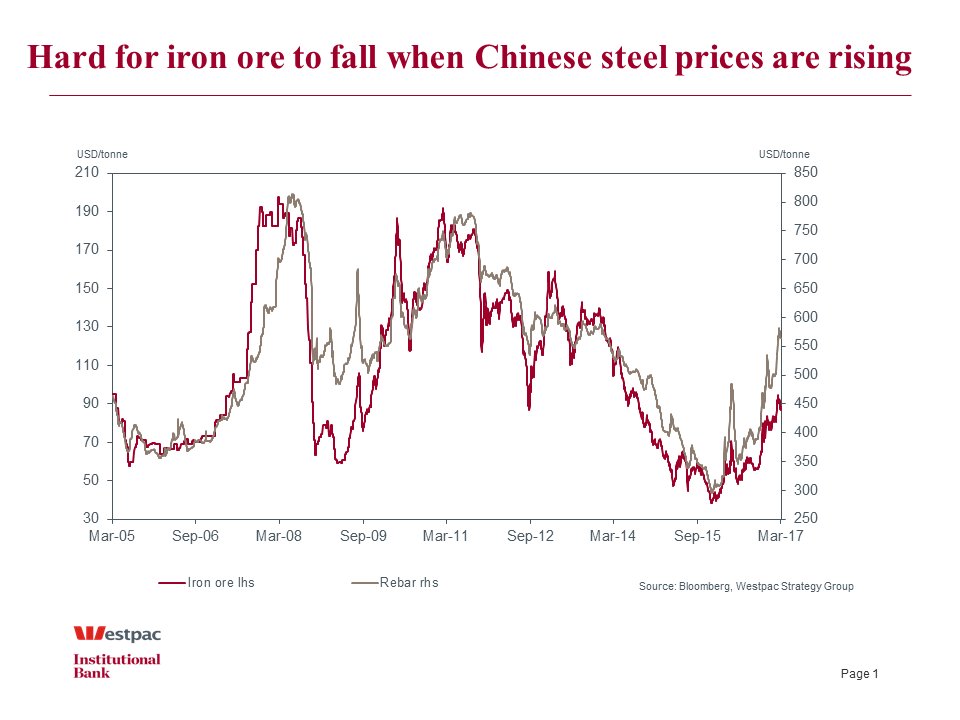
After sharp correction by about 5% on previous week, iron ore price rebounded up to over USD 90/t again, reaching USD 92.6/t on Thursday. Year-to-date, iron ore price index has rallied 17.4%, on top of the 80%-plus gains recorded in 2016. Main drivers of growth – according to the latest statistics Chinese steel production grew in January-February by 5.8%, which supported both steel and iron ore prices, on the other hand Dalian Exchange decided to temporarily cut trading fees for iron ore futures contract, which can be a factor of growth as well.
On the chart below (source - Westpac) you can see clear correlation of iron ore and rebar prices since Y2005:
As for agri-commodities, during reporting week wheat and corn prices on Chicago Exchange increased by 2-3%, paring main part of previous week losses. As a result corn price in Ukrainian ports somewhat increased from previous week’s level of USD 152-155/t. Wheat remained stable at about USD 159-175/t, while soybeans price declined to USD 380/t. Sunflower seeds showed the worst dynamics during last period of time – its price declined to USD 705-710/t, which is close to the lowest levels for last years.
Popular on site:
Ukrainian Y2016 agri-commodities export digest
Ukrainian sunflower seeds and oil market
Ukrainian soybeans market is ready for new records