28 April 2024
Ukrainian grains growing statistics
Key information on Ukrainian grains growing since Y2005 - yields, sown area, total output by crop - corn, wheat, sunseeds, soybeans
Wheat
General statistics
Year
Area, k ha
Yield, t/ha
Output k tons
2005
6 571
2.85
18 699
2006
5 511
2.53
13 947
2007
5 951
2.34
13 938
2008
7 054
3.67
25 885
2009
6 753
3.09
20 866
2010
6 284
2.68
16 844
2011
6 657
3.35
22 324
2012
5 630
2.80
15 761
2013
6 566
3.39
22 278
2014
6 015
4.01
24 121
2015
6 833
3.88
26 491
2016
6 190
4.20
26 000
2017
6 361
4.11
26 144
2018
6 604
3.73
24 633
2019
6 809
4.16
28 325
2020
6 571
3.83
25 167
2021
7 050
4.59
32 441
2022
4 979
4.05
20 176
2023
4 658
4.64
21 625
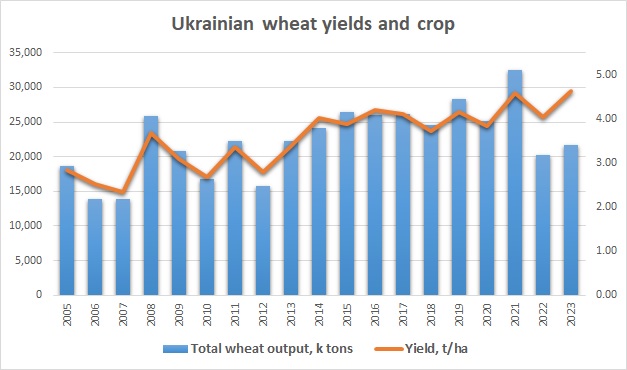
Total wheat output and yields graph:
Corn
General statistics
Year
Area, k ha
Yield, t/ha
Output, k tons
2005
1 660
4.32
7 167
2006
1 720
3.74
6 426
2007
1 903
3.90
7 421
2008
2 440
4.69
11 447
2009
2 089
5.02
10 486
2010
2 648
4.50
11 919
2011
3 544
6.44
22 838
2012
4 370
4.79
20 922
2013
4 825
6.40
30 900
2014
4 625
6.16
28 500
2015
4 080
5.72
23 330
2016
4 240
6.60
27 984
2017
4 480
5.51
24 685
2018
4 564
7.84
35 782
2019
4 974
7.19
35 763
2020
5 432
5.41
29 387
2021
5 500
7.68
42 100
2022
4 124
6.35
26 187
2023
3 975
7.81
31 030
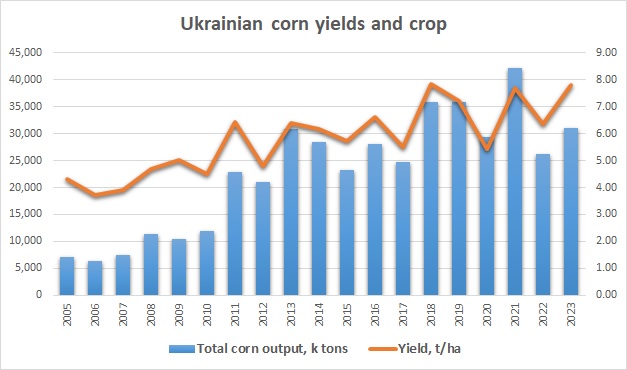
Total corn output and yields graph:
Sunflower seeds
General statistics
Year
Area, k ha
Yield, t/ha
Output, k tons
2005
3 743
1.26
4 706
2006
3 964
1.34
5 324
2007
3 604
1.16
4 174
2008
4 306
1.52
6 526
2009
4 232
1.50
6 364
2010
4 572
1.48
6 772
2011
4 739
1.83
8 671
2012
5 194
1.61
8 387
2013
5 051
2.19
11 051
2014
5 257
1.93
10 134
2015
5 105
2.19
11 165
2016
6 073
2.24
13 627
2017
6 034
2.03
12 236
2018
6 117
2.32
14 165
2019
5 928
2.57
15 254
2020
6 457
2.03
13 110
2021
6 622
2.46
16 392
2022
5 293
2.14
11 329
2023
5 220
2.45
12 760
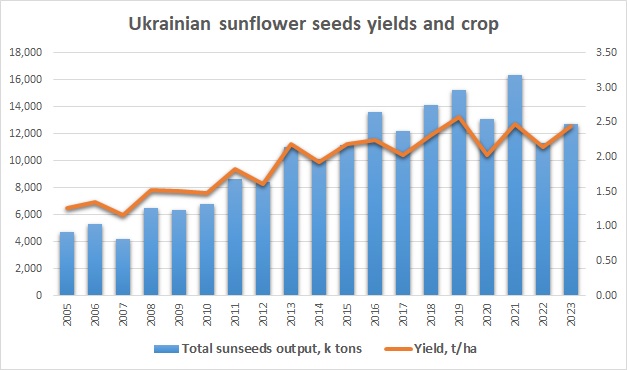
Total sunseeds output and yields (you can read more on Ukrainian sunseeds and sunoil market here):
Soybeans
General statistics
Year
Area, k ha
Yield, t/ha
Output k tons
2005
422
1.45
613
2006
715
1.24
890
2007
583
1.24
723
2008
538
1.51
813
2009
623
1.68
1 044
2010
1 037
1.62
1 680
2011
1 110
2.04
2 264
2012
1 411
1.71
2 410
2013
1 351
2.05
2 774
2014
1 800
2.17
3 900
2015
2 100
1.79
3 761
2016
1 860
2.31
4 297
2017
1 982
1.97
3 905
2018
1 729
2.58
4 461
2019
1 579
2.29
3 616
2020
1 351
2.07
2 797
2021
1 310
2.64
3 493
2022
1 527
2.26
3 443
2023
1 834
2.59
4 743
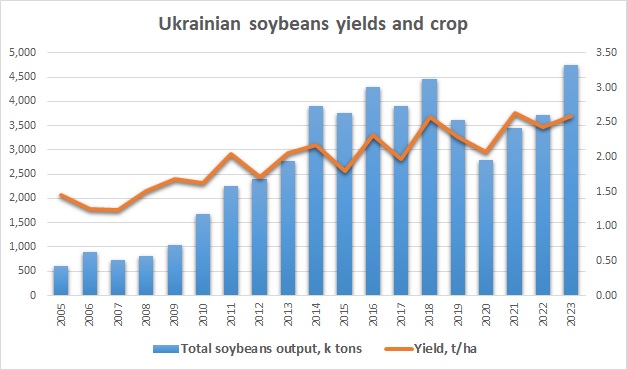
Total soybeans output and yields graph: