IMC is one of the largest Ukrainian agri-holdings with a total land bank of 120,000 hectares, located in Poltava, Chernihiv and Sumy regions. By the size of the land bank, the company belongs to TOP-10 Ukrainian agricultural companies.
After the IPO on the Warsaw Stock Exchange in May 2011 and until the beginning of 2014, Industrial Milk Company carried out a significant expansion, increasing its land bank from 40 thousand hectares in 2010 to 137 thousand hectares.
Silo capacity was also significantly increased - from 172 thousand tons of one-time storage to 550 thousand tons. Such aggressive development was largely financed by bank loans, so the company's overall debt load increased as well.
Since 2014, IMC management decreased investments, it has been focused on business efficiency and reduction of the debt burden, which contributed to better financial stability of the holding. During 2014-2020, IMC reduced its loans portfolio by more than $100 million, and since then the company's financial condition has remained good.
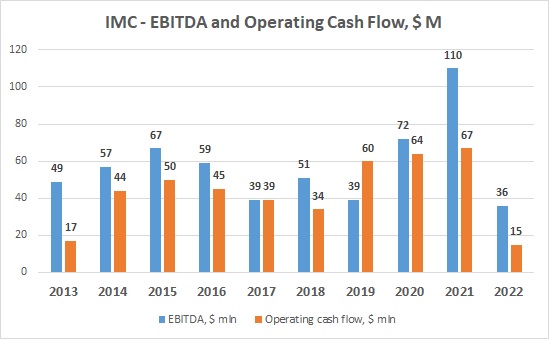
The company's profitability indicators are quite good as well, taking into account changes in crop yields and the general dynamics of grain prices. The dynamics of the company's EBITDA and operating cash flow are shown in the graph below:
Since 2017, IMC has been paying dividends to its shareholders. From 2017 to 2021, a total of more than $60 million was paid out, which helped to increase the company's market capitalization (even as of March 2023, under full-scale war conditions, IMC's capitalization is twice as high as it was at the beginning of 2017).
In recent years, corn takes more than 50% of the total sown areas of the IMC. Other crops in the crop rotation are sunflower, wheat, soy.
At the moment, the company's total grain storage capacity is 554,000 tons. The presence of significant silo capacities allows the holding to be more flexible in terms of choosing the period of grains sales during the season, as well as to have savings on drying, storage and shipping of grain.
The main operating risks of the company are the lack of diversification (IMK focuses on late grain crops, which makes it dependent on weather conditions in the main operating regions in July - August), as well as absence of vertical integration.
At the same time, the company's land bank is mainly located in a region with a fairly high rate of precipitation, so, for example, the drought in Ukraine in 2020 had almost no effect on the yield of the main crops in IMC (corn yield in IMC was 9.3 t/ha compared to 5.6 t /ha on average in Ukraine).
The full-scale invasion of the russian federation significantly affected the company's activities. A significant part of the IMC land bank was located in the region of active hostilities in March, so despite the withdrawal of the russian troops from northern Ukraine at the end of March, large areas were still mined.
Thus, in 2022, the total planted area of IMC decreased by 32,000 hectares (mainly in Chernihiv region) to 88,000 hectares.
From the point of view of the yield of the main crops in 2022, the situation was quite good - the yield of corn was 10.5 t/ha, sunflower - 3.4 t/ha, wheat - 6.7 t/ha.
We can expect quite good financial performance of the company for 2022 and the first half of 2023.
Sown areas and yield of main crops:
Season
2022/2023
2021/2022
2020/2021
2019/2020
2018/2019
2017/2018
Corn
Sown area, ha
50 200 68 000 69 200 69 500 68 400 67 000
Yield, t/ha
10.5 10.6 9.3 9.7 11.1 9.1
Sunflower
Sown area, ha
19 200 25 700 25 800 22 800 23 700 24 700
Yield, t/ha
3.4 3.5 3.5 3.7 3.5 2.9
Wheat
Sown area, ha
18 300 21 400 21 200 13 100 12 700 13 700
Yield, t/ha
6.7 5.7 5.8 6.3 5.5 5.7
Total area, ha
87 700 120 000 123 000 123 000 123 900 129 600
Financial information
| $ mln | 2021 | 2020 | 2019 | 2018 | 2017 |
|---|---|---|---|---|---|
| Revenue | 182 | 161 | 170 | 132 | 127 |
| Gross profit | 111 | 79 | 51 | 66 | 50 |
| EBITDA | 110 | 72 | 39 | 51 | 39 |
| EBITDA margin, % | 60% | 45% | 23% | 38% | 31% |
| Net profit | 79 | 32 | 7 | 28 | 18 |
| 31.12.21 | 31.12.20 | 31.12.19 | 31.12.18 | 31.12.17 | |
| Total assets | 414 | 280 | 298 | 198 | 180 |
| Fixed assets | 235 | 163 | 182 | 77 | 88 |
| Current assets | 178 | 116 | 121 | 117 | 92 |
| Inventory | 138 | 93 | 105 | 109 | 77 |
| Cash | 29 | 18 | 5 | 4 | 6 |
| Equity | 191 | 138 | 133 | 121 | 104 |
| Debt | 33 | 33 | 47 | 45 | 63 |